Actuated Dashboard
The actuated dashboard is available to customers for their enrolled organisations.
For each organisation, you can see:
- Today's builds so far - a quick picture of today's activity across all enrolled organisations
- Runners - Your build servers and their status
- Build queue - All builds queued for processing and their status
- Insights - full build history and usage by organisation, repo and user
- Job Increases - a list of jobs that have increased in duration over 5 minutes, plus a list of the affected jobs that week
Plus:
- CLI - install the CLI for management via command line
- SSH Sessions - connect to a runner via SSH to debug issues or to explore - works on hosted and actuated runners
Today's builds so far
On this page, you'll get today's total builds, total build minutes and a break-down on the statuses - to see if you have a majority of successful or unsuccessful builds.

Today's activity at a glance
Underneath this section, there are a number of tips for enabling a container cache, adjusting your subscription plan and for joining the actuated Slack.
More detailed reports are available on the insights page.
Runners
Here you'll see if any of your servers are offline, in a draining status due a restart/update or online and ready to process builds.
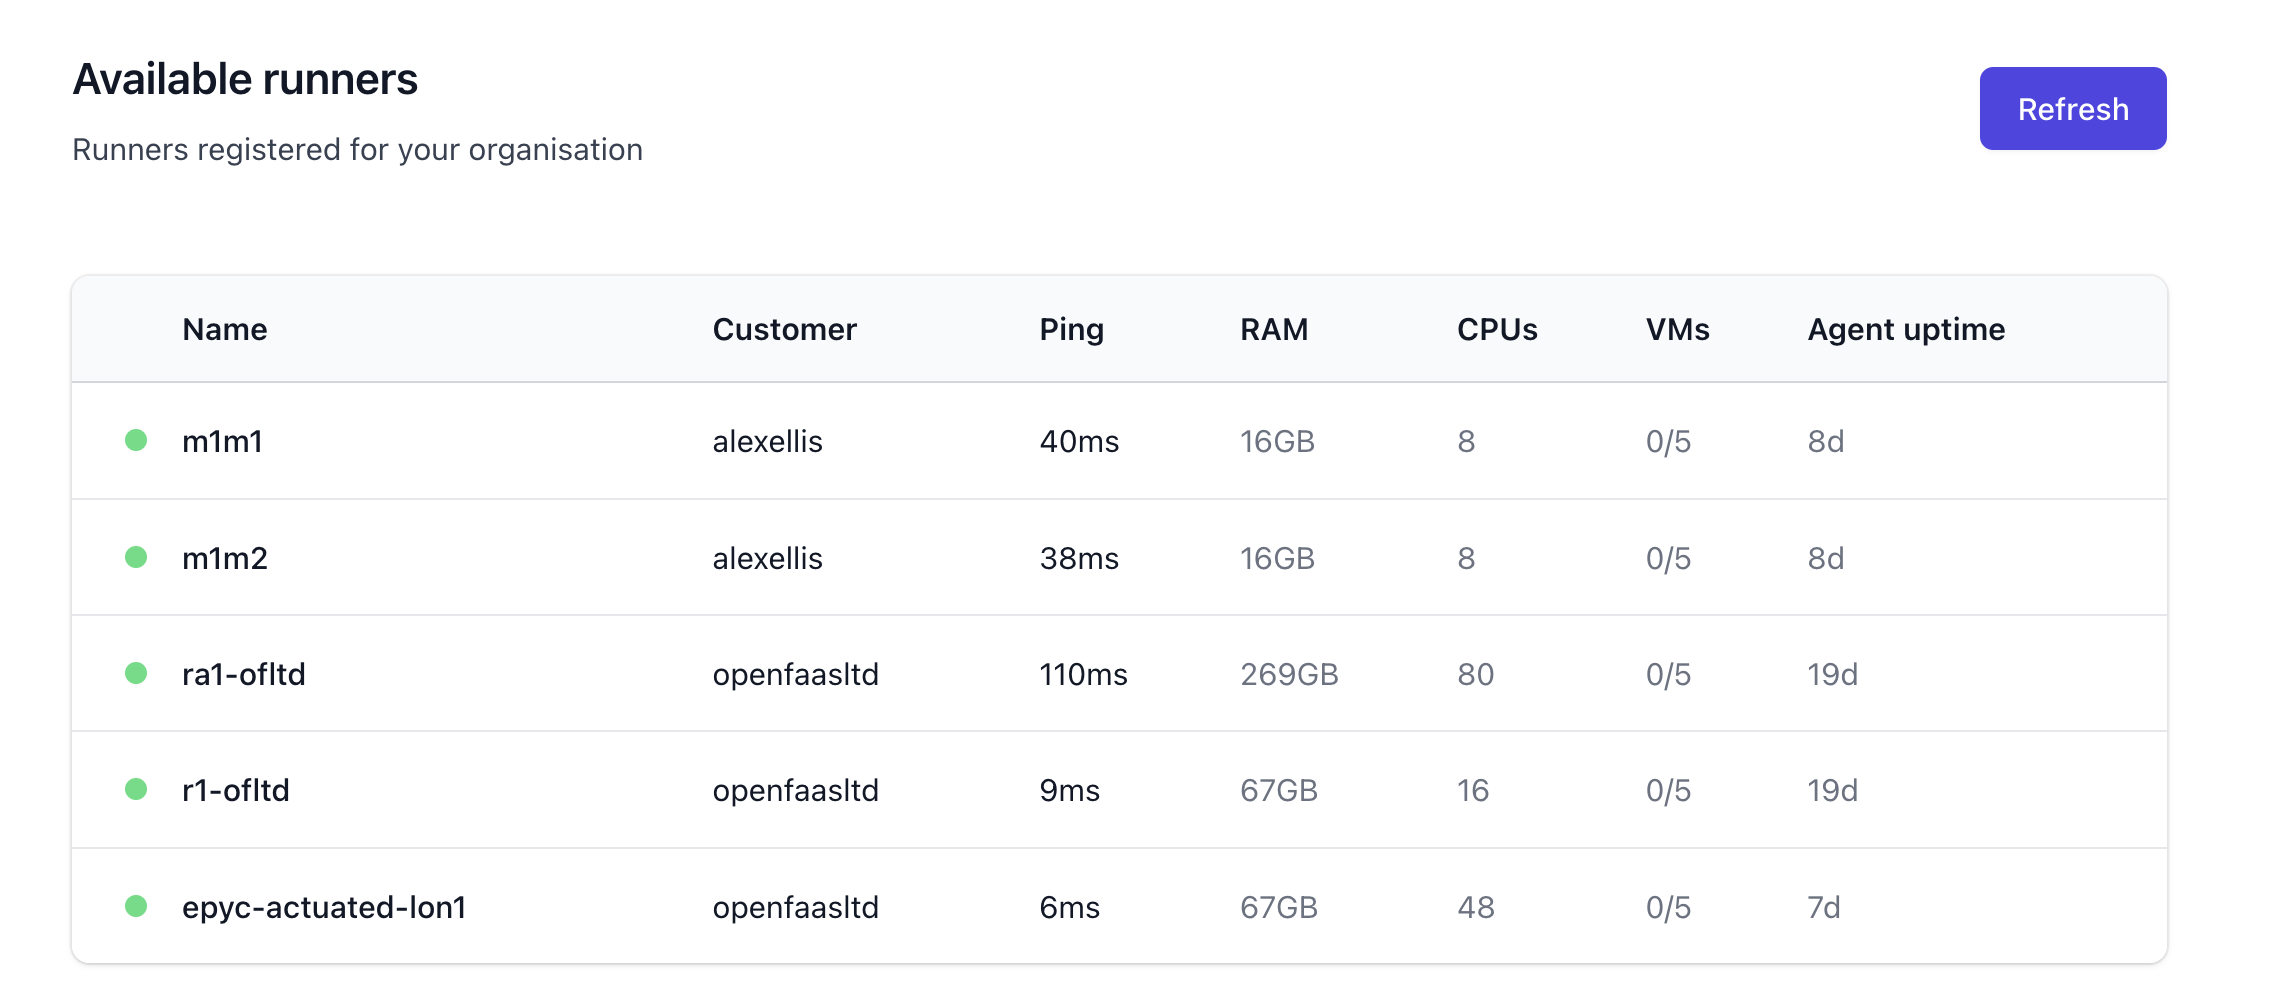
The Ping time is how long it takes for the control-plane to check the agent's capacity.
Build queue
Only builds that are queued (not yet in progress), or already in progress will be shown on this page.
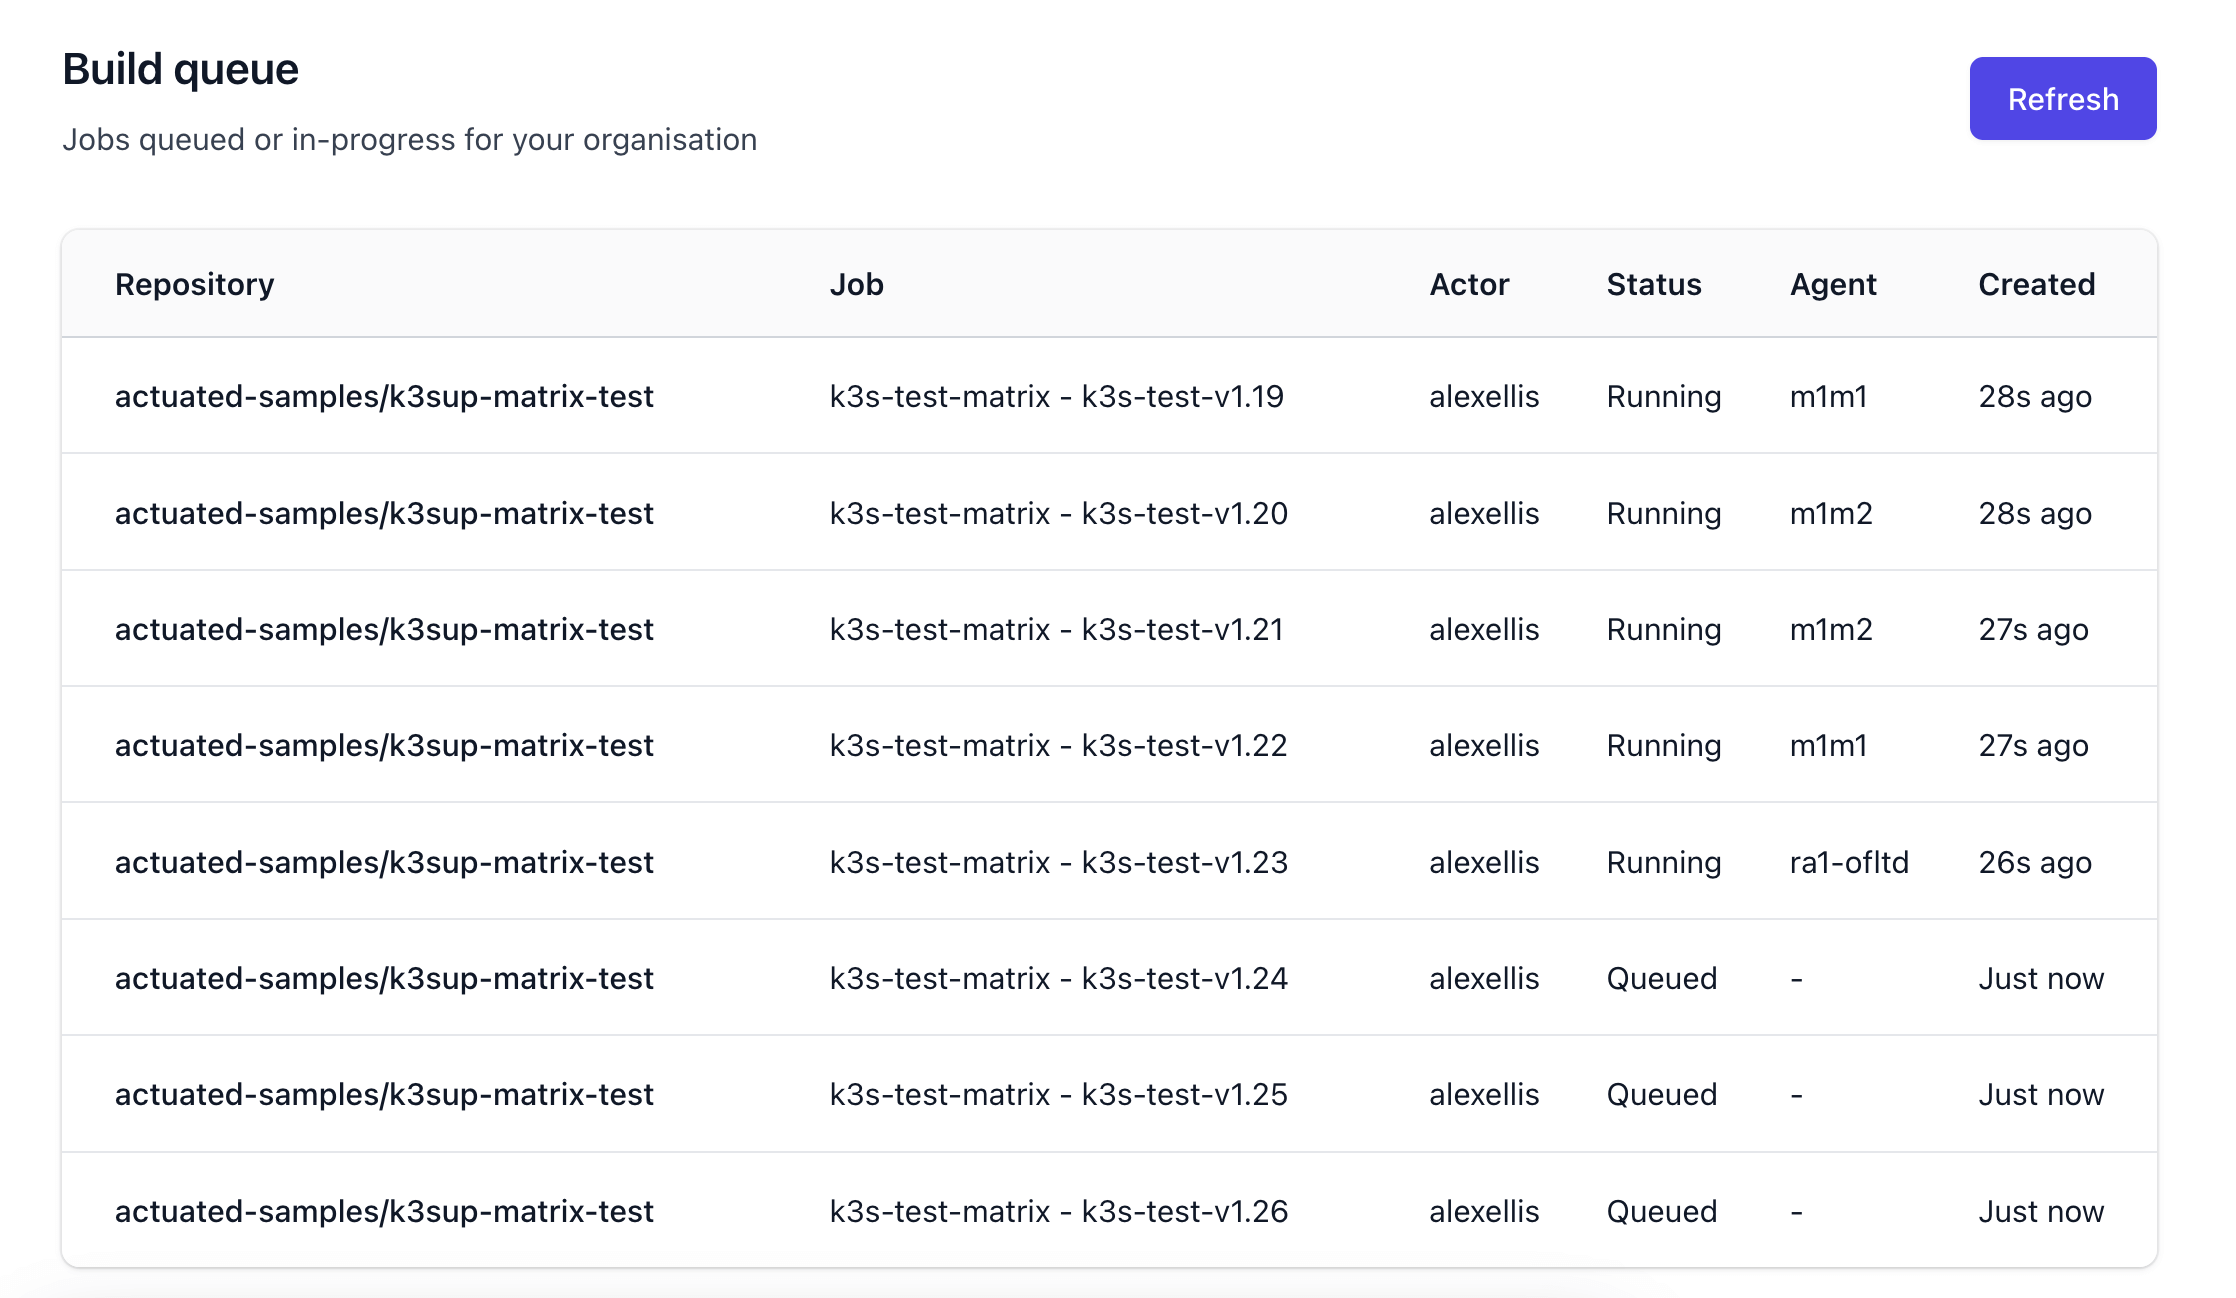
Find out how many builds are pending or running across your organisation and on which servers.
Insights
Three sets of insights are offered - all at the organisation level, so every repository is taken into account.
You can also switch the time window between 28 days, 14 days, 7 days or today.
The data is contrasted to the previous period to help you identify spikes and potential issues.
The data for reports always starts from the last complete day of data, so the last 7 days will start from the previous day.
Build history and usage by organisation.
Understand when your builds are running at a higher level - across all of your organisations - in one place.
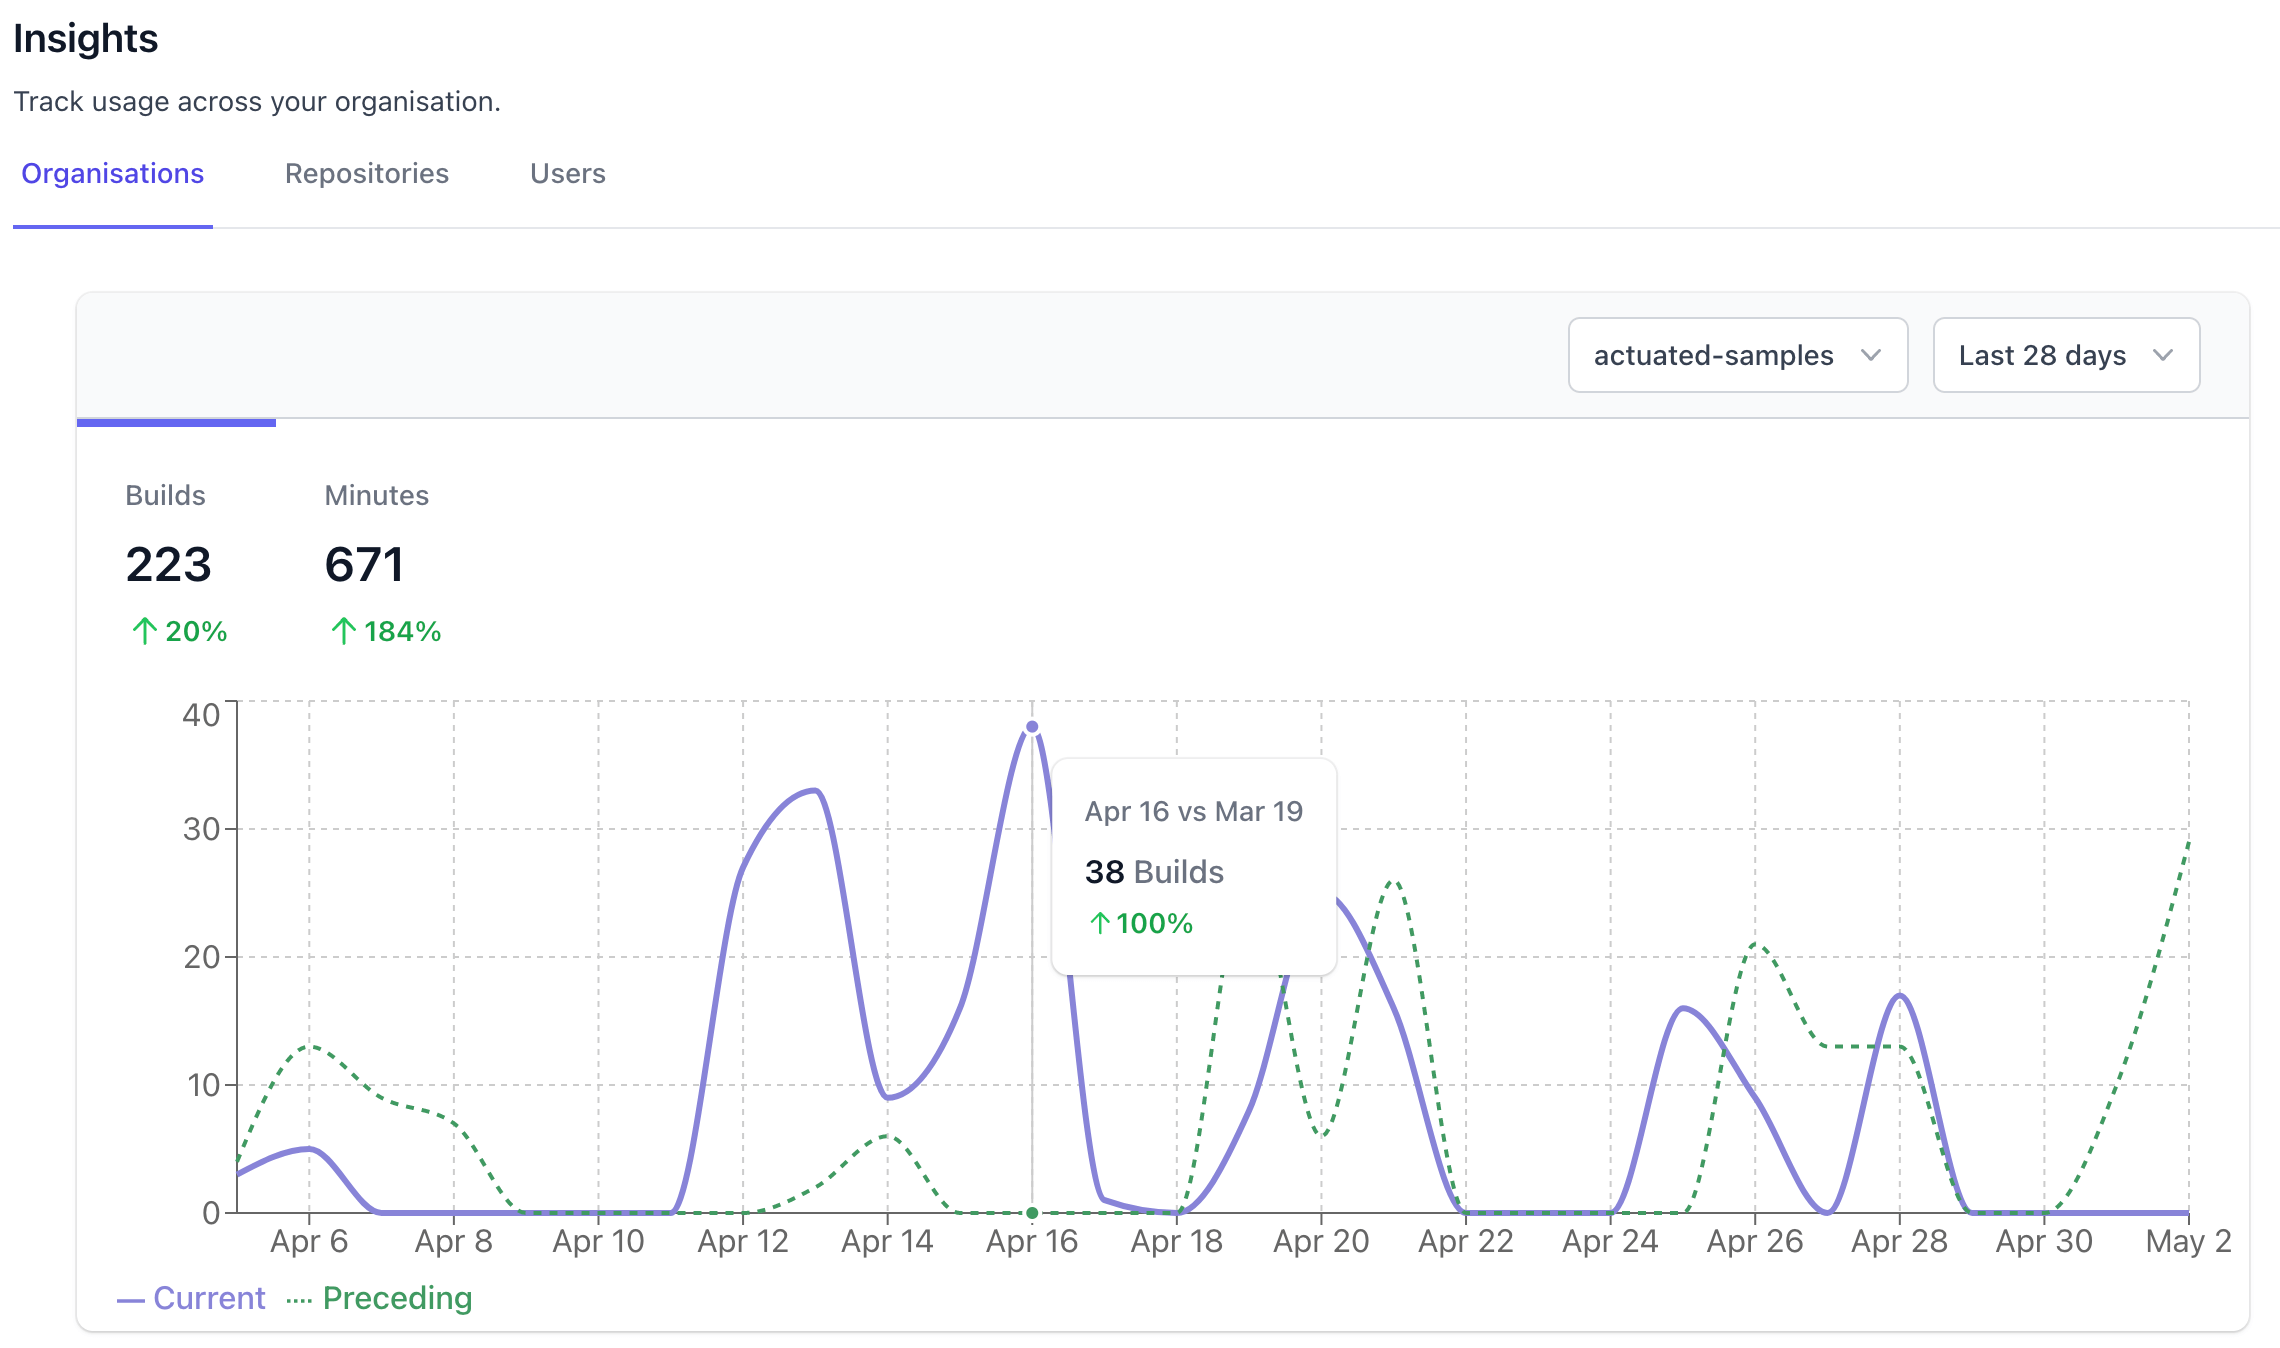
You can click on Minutes to switch to total time instead of total builds, to see if the demand on your servers is increasing or decreasing over time.
Build history by repository
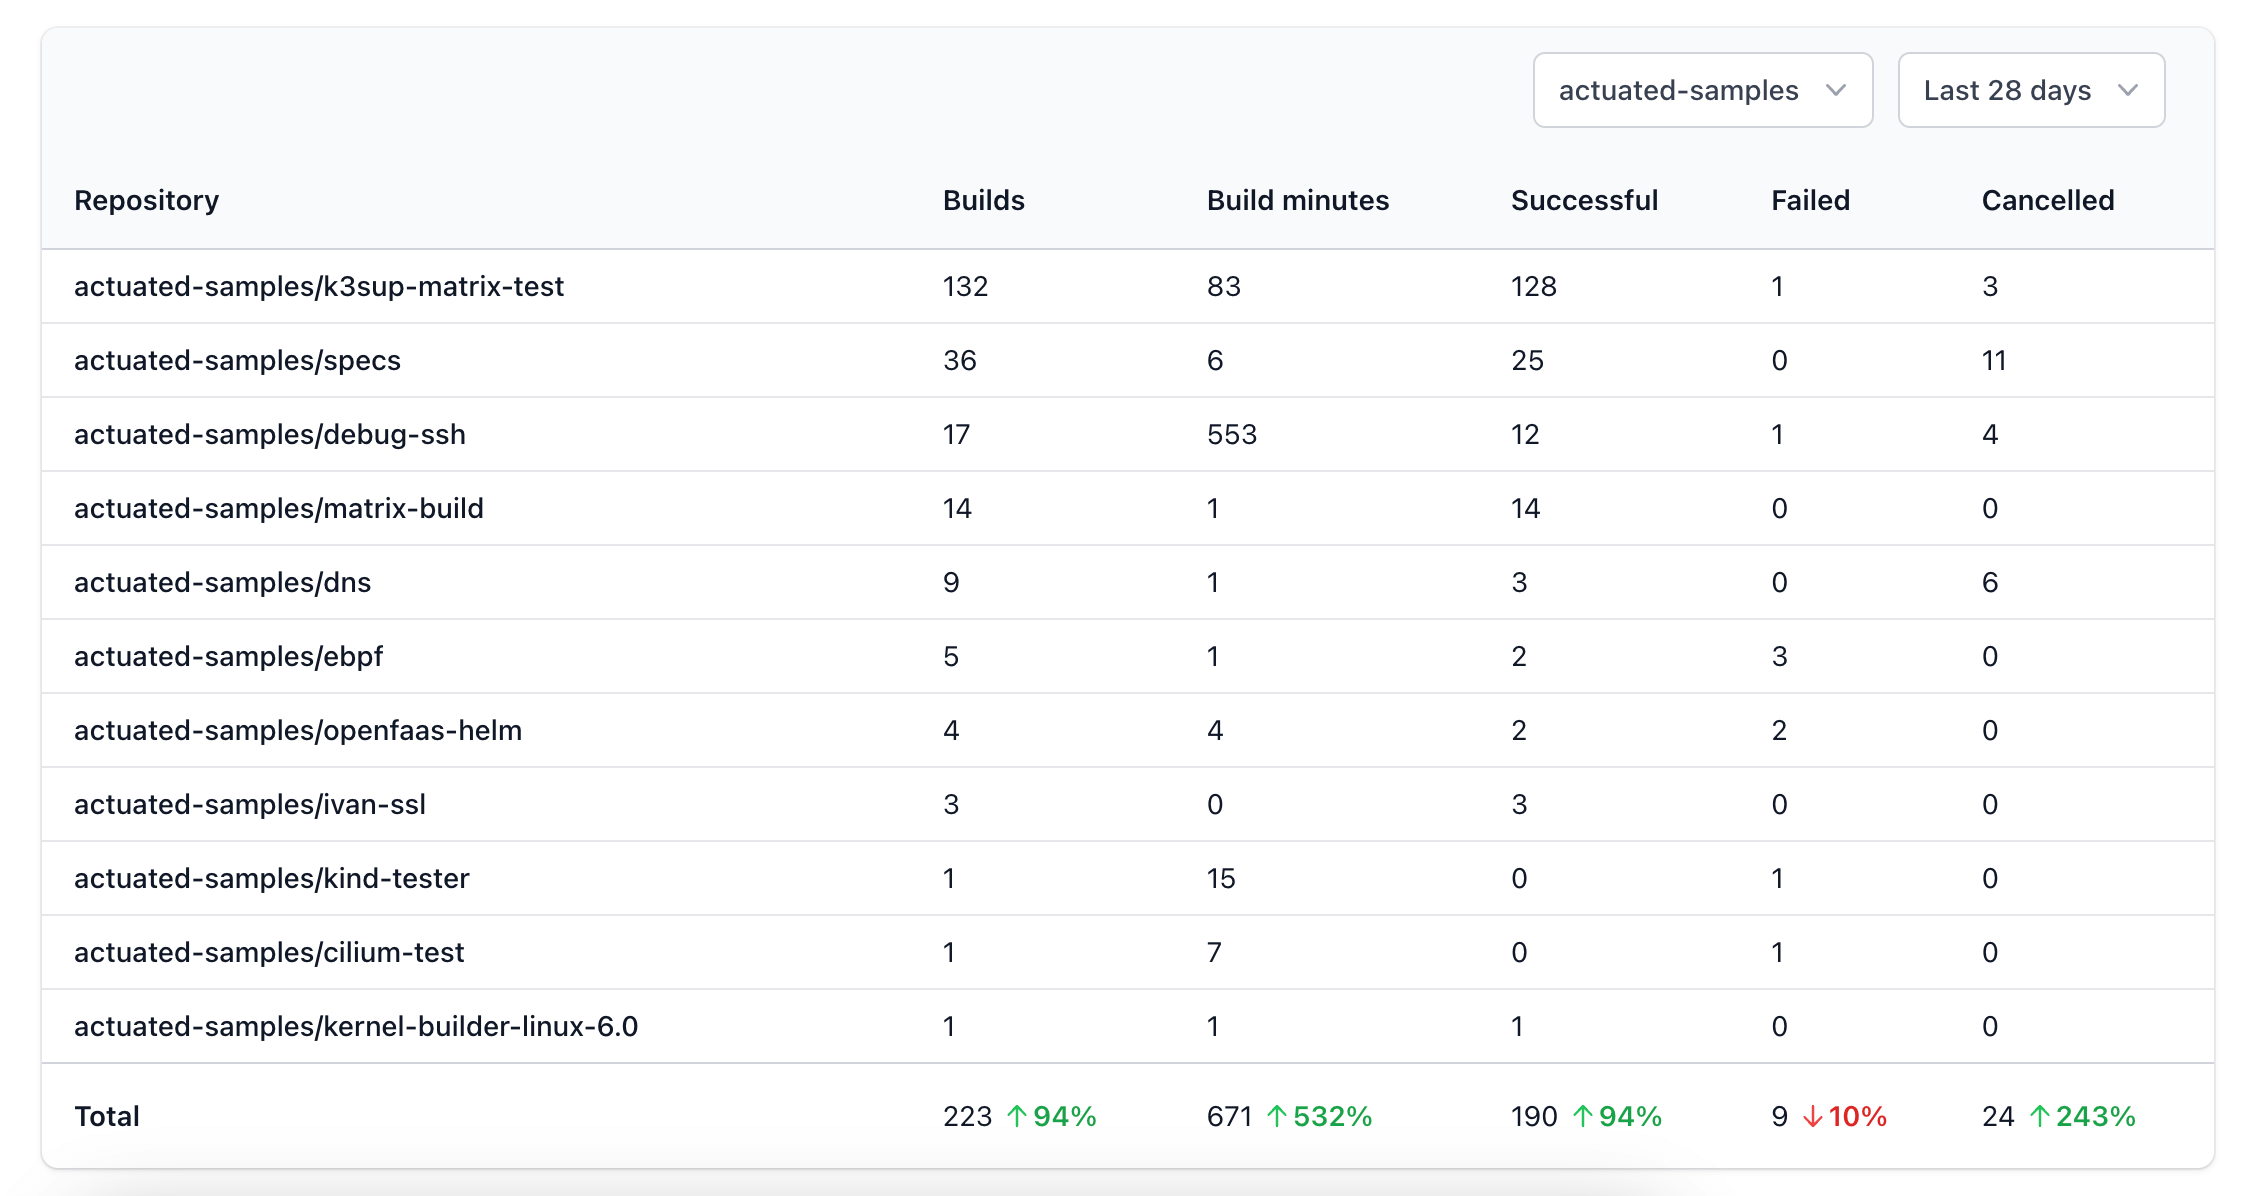
When viewing usage at a repository-level, you can easily identify anomalies and hot spots - like mounting build times, high failure rates or lots of cancelled jobs - implying a potential faulty interaction or trigger.
Build history per user

This is where you get to learn who is trigger the most amount of builds, who may be a little less active for this period and where folks may benefit from additional training due a high failure rate of builds.
Job Increases
For up to 120 days of history, you can find jobs that have increased over 5 minutes in duration week-by-week. This feature was requested by a team whose builds were roughly 60 minutes each on GitHub's hosted runners, and 20 minutes each on actuated. They didn't want those times to creep up without it being noticed and rectified.
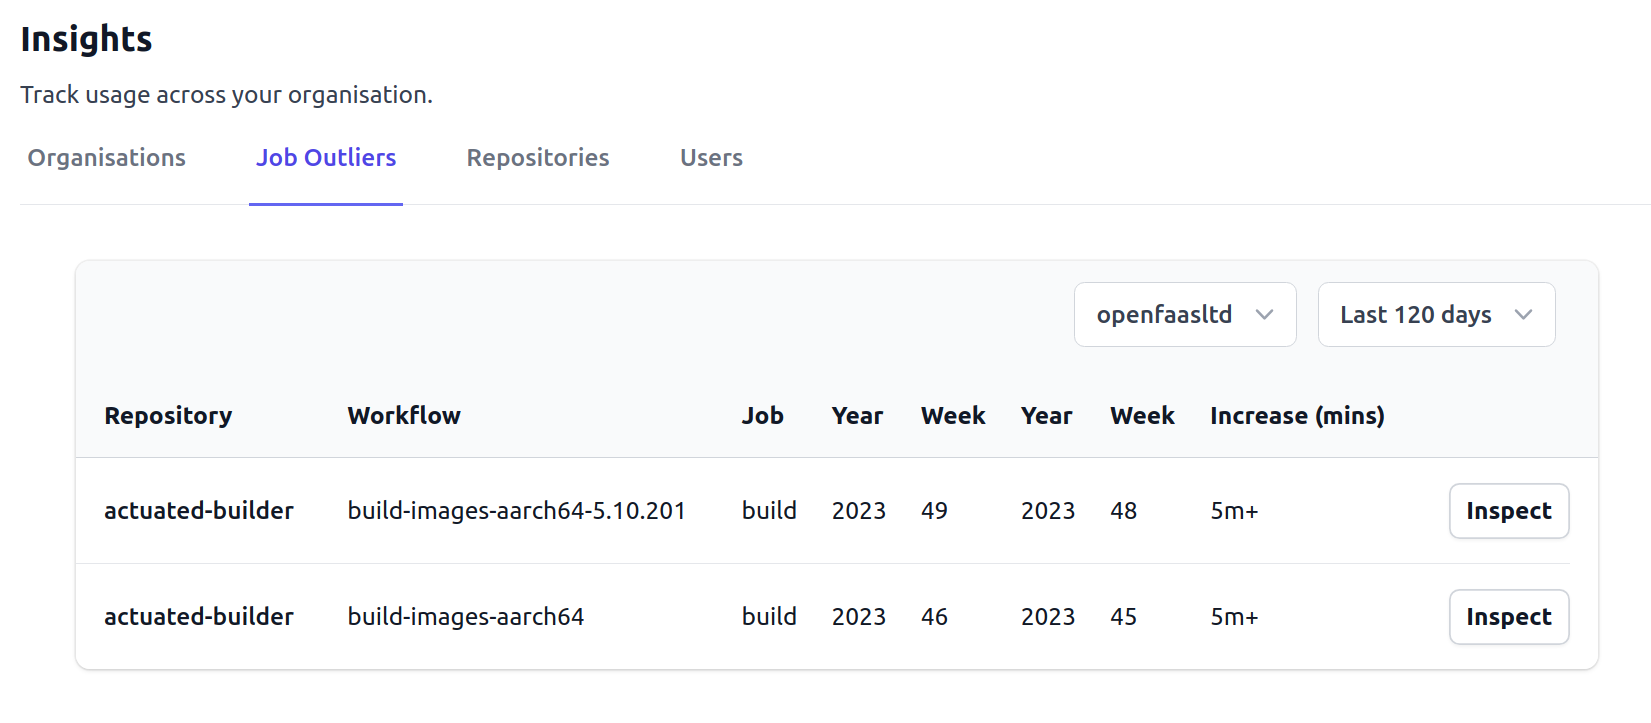
Insights on outliers showing the time that the job increased by, and a button to drill down into the affected jobs that week.
When you click "Inspect", a plot will be drawn with the maximum build time recorded on the days of the affected week. You can then click "View Job" to see what commit, Pull Request, or configuration change may have caused the increase.
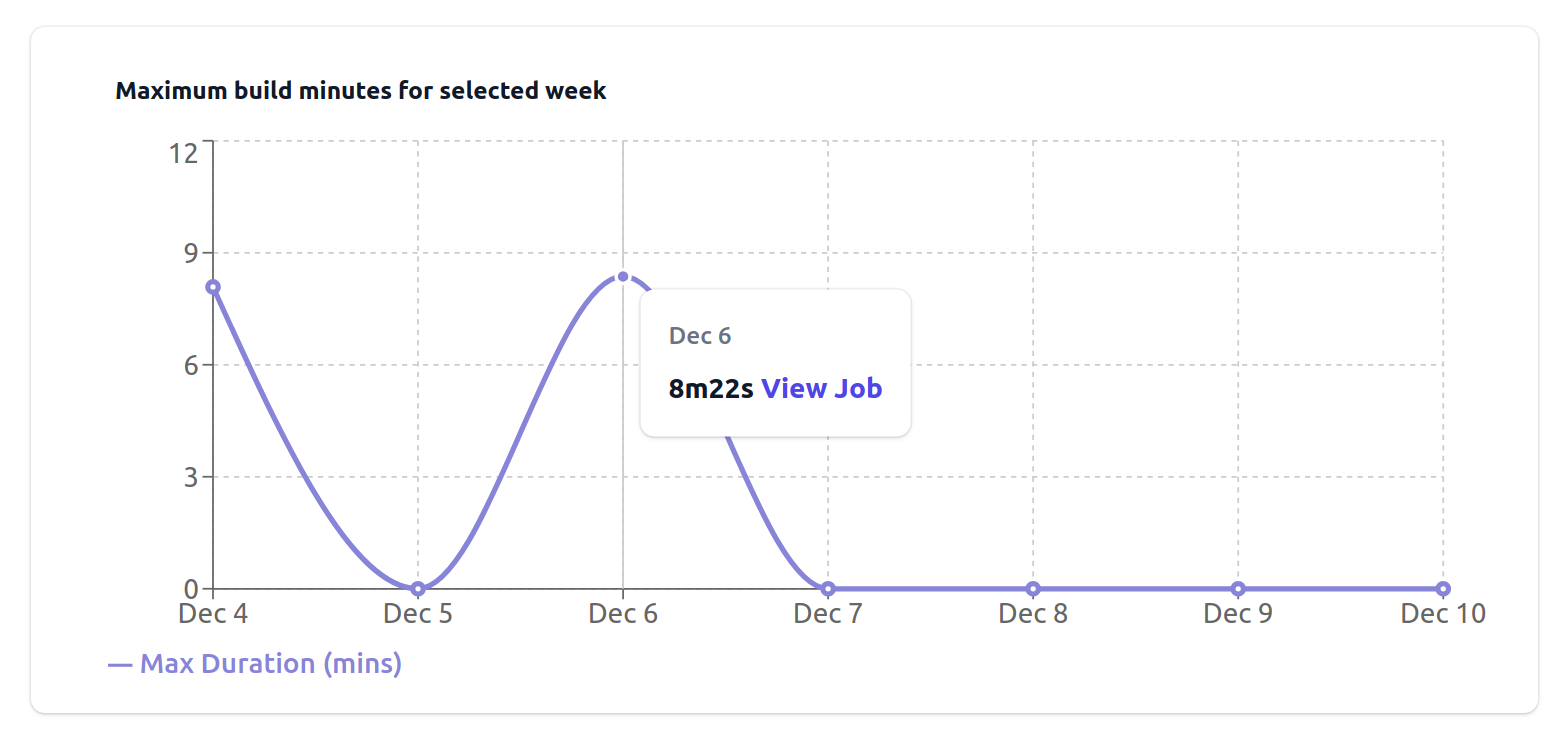
A plot with the longest job run on each day of the affected week
SSH Sessions
Once you configure an action to pause at a set point by introducing our custom GitHub action step, you'll be able to copy and paste an SSH command and run it in your terminal.
Your SSH keys will be pre-installed and no password is required.
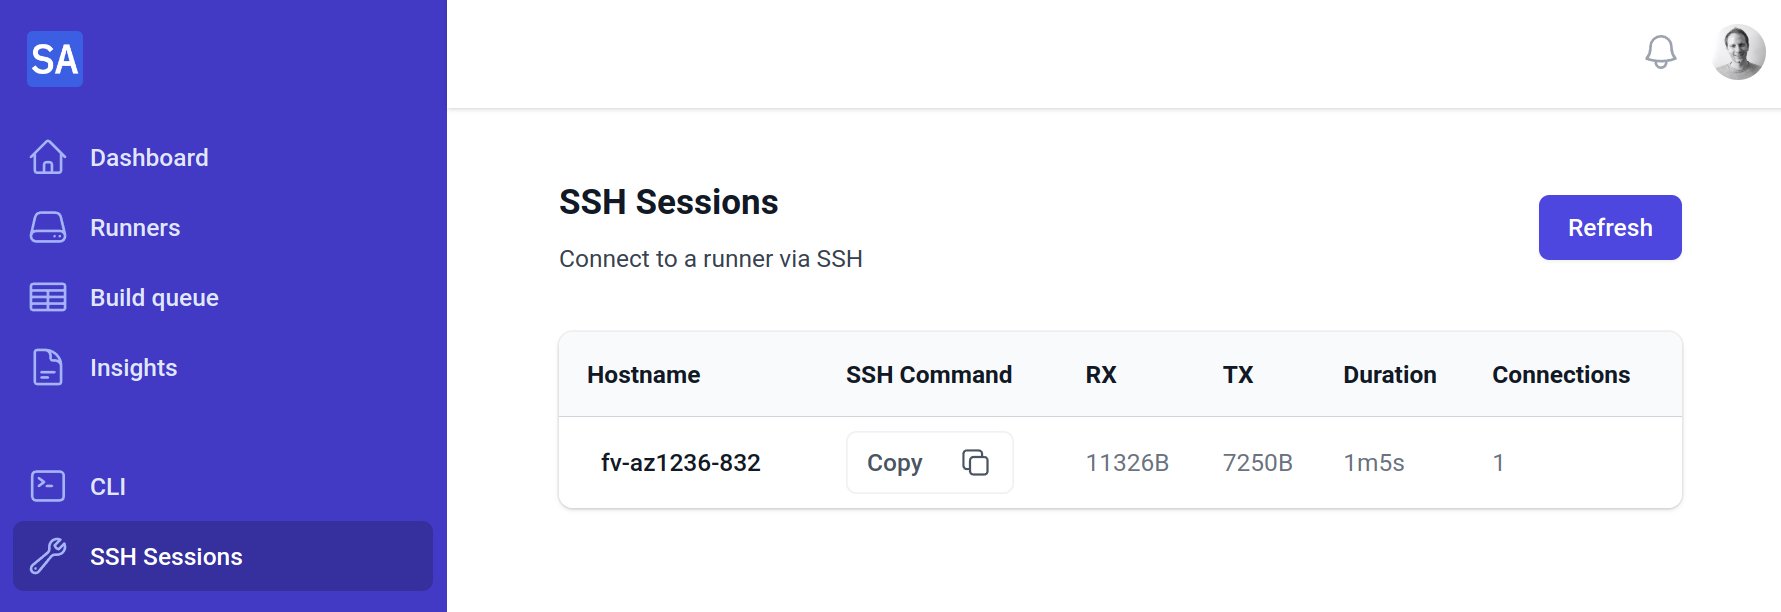
Viewing an SSH session to a hosted runner
See also: Example: Debug a job with SSH
CLI
The CLI page has download instructions, you can find the downloads for Linux, macOS and Windows here: